
Digital Shelf Analysis
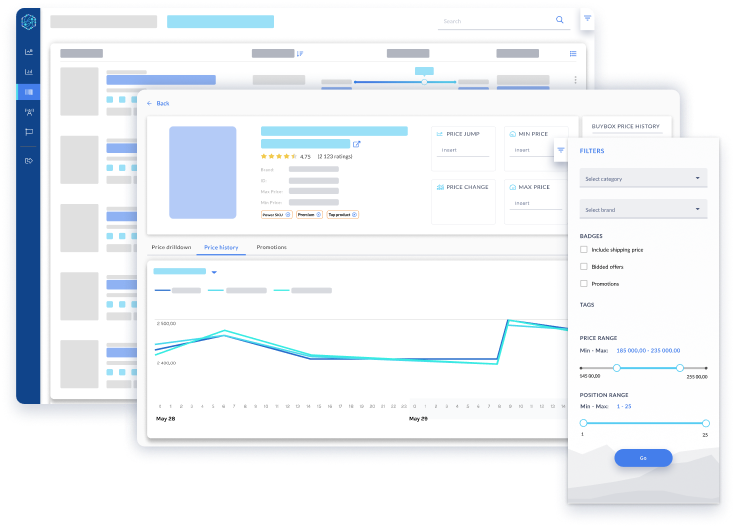
Prices and Promotions are fundamentals of e-commerce – every retailer has to have them and use them. But to understand the big picture of the retail specifics, you need reliable and instant access to accurate data. Modvise provides a complete overview of both Price Changes and Promotional activity, which occurs on your and competitive products. Based on the details we deliver, you will be able to act quickly in a well-educated manner. Learn more about price discrimination opportunities to improve your pricing strategy.
Data Benchmarking
Dashboard and Analytics
Data Export and API
Data Benchmarking
Competitive products
The Modvise matching algorithm gives you an instant insight into which products you have in common with your competitors. This way, you will have a direct view of products that are the most competitive and also in which you have an advantage in position.
Trending products
Detect trending products in the competitive e-commerce that you do not have. Comprehensive data gathered in one place will help you to construct a competitive and beneficial assortment in stock.
Dashboard and Analytics

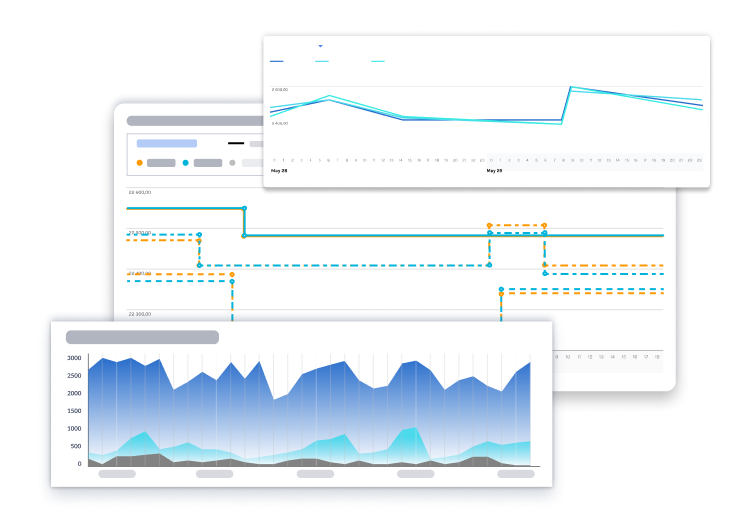
Configurable graphs
We designed a set of configurable graphs specifically for the analysis of competitive product assortment. Thanks to numerous functions we created, you can observe the growth and rhythm of assortment changes among your competitors, helping you fix prices for new releases of products.
Visual analysis
Visualize how many products your competitors have in their catalogues, what kind and number of novelties they incorporate each month, how dynamic their prices are, what percentage of availability they have, how many prices they update per day. Just pick an attractive factor you need to analyse better.
Data Export and API

Internal reporting
Many of our Clients use our data stream to build their own internal reporting in BI tools like Tableau, Qlik, or PowerBI. You can do that by using our reporting system.
API and more
Export data easily to CSV and Excel files, or link your BI tools via API with our reporting system and let us be responsible for fuelling your Data Systems constantly.

Data Benchmarking
Competitive products
The Modvise matching algorithm gives you an instant insight into which products you have in common with your competitors. This way, you will have a direct view of products that are the most competitive and also in which you have an advantage in position.
Trending products
Detect trending products in the competitive e-commerce that you do not have. Comprehensive data gathered in one place will help you to construct a competitive and beneficial assortment in stock.
Dashboard and Analytics
Configurable graphs
We designed a set of configurable graphs specifically for the analysis of competitive product assortment. Thanks to numerous functions we created, you can observe the growth and rhythm of assortment changes among your competitors, helping you fix prices for new releases of products.
Visual analysis
Visualize how many products your competitors have in their catalogues, what kind and number of novelties they incorporate each month, how dynamic their prices are, what percentage of availability they have, how many prices they update per day. Just pick an attractive factor you need to analyse better.
Data Export and API
Internal reporting
Many of our Clients use our data stream to build their own internal reporting in BI tools like Tableau, Qlik, or PowerBI. You can do that by using our reporting system.
API and more
Export data easily to CSV and Excel files, or link your BI tools via API with our reporting system and let us be responsible for fuelling your Data Systems constantly.